


This article is part of our The Z Files series.
The recipe is pretty simple. The harder the exit velocity of a batted ball, the better the chance of it being a hit. Here is a visualization of the BABIP data since 2018, parsing contact into grounders, outfield line drives and flyballs, over the following exit velocities:
- 95-100
- 100-105
- 105-110
- 100+
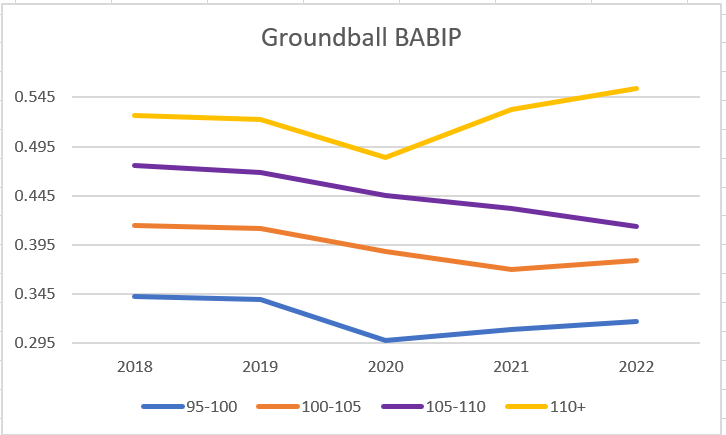
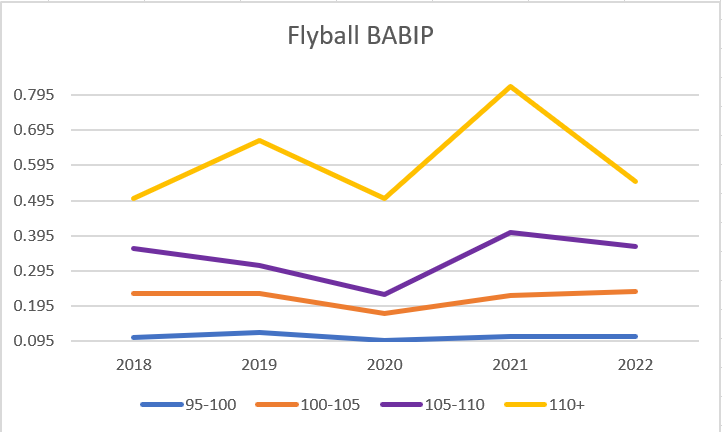
I'm not especially interested in the trends, at least not yet. I'll revisit the data when deciding how to regress batted ball data for projections, especially if MLB institutes legislation of the shift. For today, the pretty colored graphs serve as a foundation when the stats for several batters are dissected.
Specifically, batted ball data since the break will be reviewed. Everyone with at least 75 plate appearances through Sunday's action will be included.
The underlying notion is players crushing the ball since the break have a better chance to be productive down the stretch. It can be argued acquiring the hitters now is too late as they are not likely to maintain this elevated level of performance. Maybe, maybe not. That's the holy grail. In a vacuum, the data is not predictive but we all have to make choices and some intriguing numbers will be presented.
I'm going to pick out several players I'd like to discuss. If there is someone else you'd like handled, please post their name in the comments and I'll be happy to oblige.
| Batter | PA | AVG | SLG | wOBA | ExitVel | LA | BABIP | 95-100 | 100-105 | 105-110 | >110 | |
|---|---|---|---|---|---|---|---|---|---|---|---|---|
| 1 | Matt Chapman | 80 | 0.294 | 0.676 | 0.446 | 95.6 |
The recipe is pretty simple. The harder the exit velocity of a batted ball, the better the chance of it being a hit. Here is a visualization of the BABIP data since 2018, parsing contact into grounders, outfield line drives and flyballs, over the following exit velocities:
- 95-100
- 100-105
- 105-110
- 100+
I'm not especially interested in the trends, at least not yet. I'll revisit the data when deciding how to regress batted ball data for projections, especially if MLB institutes legislation of the shift. For today, the pretty colored graphs serve as a foundation when the stats for several batters are dissected.
Specifically, batted ball data since the break will be reviewed. Everyone with at least 75 plate appearances through Sunday's action will be included.
The underlying notion is players crushing the ball since the break have a better chance to be productive down the stretch. It can be argued acquiring the hitters now is too late as they are not likely to maintain this elevated level of performance. Maybe, maybe not. That's the holy grail. In a vacuum, the data is not predictive but we all have to make choices and some intriguing numbers will be presented.
I'm going to pick out several players I'd like to discuss. If there is someone else you'd like handled, please post their name in the comments and I'll be happy to oblige.
| Batter | PA | AVG | SLG | wOBA | ExitVel | LA | BABIP | 95-100 | 100-105 | 105-110 | >110 | |
|---|---|---|---|---|---|---|---|---|---|---|---|---|
| 1 | Matt Chapman | 80 | 0.294 | 0.676 | 0.446 | 95.6 | 21.8 | 0.387 | 65.8% | 50.0% | 26.3% | 5.3% |
| 2 | Tommy Pham | 96 | 0.242 | 0.407 | 0.288 | 93.3 | 5.4 | 0.339 | 62.7% | 42.4% | 15.3% | 1.7% |
| 3 | Yordan Alvarez | 93 | 0.267 | 0.520 | 0.374 | 93.7 | 11.7 | 0.300 | 61.8% | 45.5% | 23.6% | 9.1% |
| 4 | Teoscar Hernandez | 78 | 0.296 | 0.592 | 0.399 | 95.4 | 13.3 | 0.320 | 61.8% | 41.8% | 29.1% | 5.5% |
| 5 | Aaron Judge | 103 | 0.372 | 0.936 | 0.574 | 95.8 | 18.5 | 0.400 | 60.4% | 50.9% | 41.5% | 20.8% |
| 6 | Max Muncy | 82 | 0.268 | 0.563 | 0.384 | 94.5 | 21.4 | 0.326 | 56.3% | 35.4% | 16.7% | 0.0% |
| 7 | Ronald Acuna | 89 | 0.296 | 0.407 | 0.333 | 90.7 | 7.6 | 0.349 | 55.6% | 34.9% | 22.2% | 3.2% |
| 8 | Paul Goldschmidt | 78 | 0.318 | 0.727 | 0.464 | 92.4 | 13.6 | 0.295 | 54.9% | 39.2% | 19.6% | 0.0% |
| 9 | Manny Machado | 103 | 0.287 | 0.574 | 0.379 | 92.6 | 18.1 | 0.328 | 54.3% | 32.9% | 12.9% | 1.4% |
| 10 | Adolis Garcia | 100 | 0.319 | 0.516 | 0.385 | 92.7 | 10.5 | 0.403 | 53.0% | 31.8% | 15.2% | 4.5% |
| 11 | Vladimir Guerrero | 89 | 0.341 | 0.561 | 0.403 | 93.5 | 4.3 | 0.373 | 52.9% | 47.1% | 28.6% | 12.9% |
| 12 | DJ LeMahieu | 99 | 0.279 | 0.465 | 0.364 | 91.1 | 3.1 | 0.294 | 52.8% | 29.2% | 6.9% | 0.0% |
| 13 | Juan Soto | 94 | 0.286 | 0.471 | 0.411 | 91.5 | 10.9 | 0.321 | 52.6% | 36.8% | 19.3% | 3.5% |
| 14 | Luke Voit | 83 | 0.257 | 0.429 | 0.346 | 90.5 | 21.8 | 0.366 | 52.3% | 36.4% | 13.6% | 2.3% |
| 15 | Anthony Santander | 90 | 0.345 | 0.595 | 0.418 | 91.6 | 20.9 | 0.375 | 52.2% | 34.8% | 18.8% | 2.9% |
| 16 | Kyle Schwarber | 81 | 0.222 | 0.486 | 0.330 | 92 | 16.3 | 0.250 | 52.1% | 43.8% | 29.2% | 12.5% |
| 17 | Trent Grisham | 79 | 0.246 | 0.580 | 0.382 | 86.9 | 11.4 | 0.244 | 51.9% | 34.6% | 11.5% | 3.8% |
| 18 | Jose Abreu | 95 | 0.284 | 0.432 | 0.326 | 91.6 | 5.4 | 0.338 | 51.5% | 33.8% | 17.6% | 5.9% |
| 19 | AJ Pollock | 76 | 0.303 | 0.545 | 0.391 | 88.3 | 9.4 | 0.315 | 50.9% | 29.8% | 15.8% | 1.8% |
| 20 | Austin Riley | 96 | 0.326 | 0.593 | 0.417 | 94.6 | 16.4 | 0.391 | 50.7% | 47.8% | 28.4% | 11.9% |
| 21 | Pete Alonso | 94 | 0.350 | 0.625 | 0.436 | 91 | 14.2 | 0.377 | 50.0% | 37.9% | 19.7% | 6.1% |
| 22 | Lourdes Gurriel | 80 | 0.315 | 0.370 | 0.327 | 91.4 | 9.5 | 0.377 | 49.2% | 36.1% | 4.9% | 0.0% |
| 23 | MJ Melendez | 100 | 0.267 | 0.500 | 0.360 | 91.6 | 13 | 0.321 | 49.2% | 34.4% | 14.8% | 0.0% |
| 24 | Hunter Renfroe | 87 | 0.253 | 0.573 | 0.387 | 90.9 | 14.3 | 0.245 | 49.1% | 40.4% | 12.3% | 3.5% |
| 25 | Jose Miranda | 81 | 0.333 | 0.493 | 0.379 | 92.3 | 14.3 | 0.407 | 49.1% | 24.6% | 8.8% | 0.0% |
| 26 | Michael Harris | 78 | 0.315 | 0.548 | 0.385 | 88.9 | 2.1 | 0.396 | 49.0% | 35.3% | 17.6% | 5.9% |
| 27 | Donovan Solano | 78 | 0.338 | 0.485 | 0.378 | 89.7 | 11 | 0.420 | 49.0% | 32.7% | 2.0% | 0.0% |
| 28 | Randal Grichuk | 86 | 0.350 | 0.550 | 0.402 | 92.6 | 8 | 0.439 | 48.3% | 36.7% | 23.3% | 3.3% |
| 29 | Brandon Lowe | 78 | 0.222 | 0.389 | 0.291 | 90.8 | 13.9 | 0.265 | 48.1% | 25.0% | 11.5% | 0.0% |
| 30 | Andrew Vaughn | 83 | 0.299 | 0.494 | 0.361 | 90.2 | 12.1 | 0.308 | 47.8% | 25.4% | 6.0% | 3.0% |
| 31 | Eloy Jimenez | 87 | 0.383 | 0.568 | 0.418 | 91.4 | 9.4 | 0.429 | 47.8% | 28.4% | 20.9% | 6.0% |
| 32 | Nolan Arenado | 78 | 0.314 | 0.714 | 0.450 | 90.5 | 20.5 | 0.288 | 47.5% | 33.9% | 10.2% | 0.0% |
| 33 | Francisco Lindor | 94 | 0.362 | 0.575 | 0.435 | 89.9 | 11.6 | 0.424 | 46.8% | 27.4% | 4.8% | 0.0% |
| 34 | Brendan Rodgers | 102 | 0.370 | 0.489 | 0.387 | 90.7 | 3.1 | 0.410 | 46.8% | 29.1% | 15.2% | 0.0% |
| 35 | Ben Gamel | 86 | 0.205 | 0.342 | 0.288 | 89.6 | 12.9 | 0.246 | 46.6% | 24.1% | 8.6% | 0.0% |
| 36 | Yandy Diaz | 81 | 0.174 | 0.348 | 0.288 | 91.1 | 9.6 | 0.164 | 46.6% | 24.1% | 10.3% | 1.7% |
| 37 | Ian Happ | 86 | 0.301 | 0.422 | 0.322 | 89.4 | 1.5 | 0.436 | 46.3% | 27.8% | 14.8% | 0.0% |
| 38 | Bo Bichette | 76 | 0.274 | 0.493 | 0.327 | 89.9 | 18.4 | 0.333 | 46.3% | 31.5% | 9.3% | 1.9% |
| 39 | Kyle Tucker | 83 | 0.237 | 0.434 | 0.306 | 87.8 | 18.1 | 0.242 | 46.2% | 23.1% | 6.2% | 0.0% |
| 40 | Jonah Heim | 83 | 0.217 | 0.362 | 0.320 | 90.7 | 17.6 | 0.275 | 46.2% | 21.2% | 1.9% | 0.0% |
| 41 | Will Smith | 88 | 0.295 | 0.500 | 0.365 | 90.3 | 18.1 | 0.333 | 46.0% | 25.4% | 6.3% | 0.0% |
| 42 | Josh Bell | 91 | 0.178 | 0.274 | 0.271 | 89.9 | 8.6 | 0.207 | 45.8% | 20.3% | 10.2% | 0.0% |
| 43 | Nathaniel Lowe | 99 | 0.348 | 0.576 | 0.412 | 90 | 11.8 | 0.452 | 45.5% | 33.3% | 18.2% | 3.0% |
| 44 | Jurickson Profar | 104 | 0.287 | 0.468 | 0.352 | 88.9 | 14.6 | 0.329 | 45.3% | 25.3% | 5.3% | 0.0% |
| 45 | Riley Greene | 104 | 0.220 | 0.330 | 0.245 | 89 | 4.4 | 0.323 | 45.3% | 29.7% | 9.4% | 3.1% |
| 46 | Freddie Freeman | 99 | 0.313 | 0.458 | 0.371 | 91.6 | 14.4 | 0.329 | 45.3% | 22.7% | 10.7% | 0.0% |
| 47 | Josh Donaldson | 88 | 0.225 | 0.388 | 0.298 | 91.9 | 6.2 | 0.314 | 45.3% | 32.1% | 17.0% | 1.9% |
| 48 | Ryan McMahon | 83 | 0.250 | 0.500 | 0.355 | 88.6 | 9 | 0.283 | 45.1% | 21.6% | 9.8% | 3.9% |
| 49 | Matt Olson | 95 | 0.229 | 0.506 | 0.351 | 91.5 | 11.9 | 0.226 | 45.0% | 36.7% | 18.3% | 5.0% |
| 50 | Shohei Ohtani | 96 | 0.237 | 0.550 | 0.362 | 91.8 | 14.8 | 0.222 | 45.0% | 31.7% | 18.3% | 1.7% |
| 51 | Mookie Betts | 109 | 0.313 | 0.586 | 0.399 | 91 | 17.3 | 0.305 | 44.8% | 27.6% | 10.3% | 0.0% |
| 52 | Jesus Aguilar | 82 | 0.189 | 0.392 | 0.267 | 89.5 | 20.5 | 0.196 | 44.6% | 21.4% | 16.1% | 0.0% |
| 53 | Xander Bogaerts | 91 | 0.253 | 0.410 | 0.309 | 90 | 16.4 | 0.311 | 44.4% | 27.0% | 9.5% | 0.0% |
| 54 | Josh Naylor | 80 | 0.276 | 0.421 | 0.316 | 89.7 | 9.4 | 0.317 | 44.3% | 26.2% | 14.8% | 4.9% |
| 55 | Oneil Cruz | 78 | 0.194 | 0.417 | 0.283 | 89 | 2.6 | 0.237 | 44.2% | 20.9% | 16.3% | 9.3% |
| 56 | Bryson Stott | 83 | 0.299 | 0.416 | 0.333 | 89.7 | 12 | 0.324 | 44.1% | 19.1% | 1.5% | 0.0% |
| 57 | Christian Walker | 93 | 0.267 | 0.500 | 0.335 | 89.5 | 19.6 | 0.265 | 43.8% | 30.1% | 15.1% | 2.7% |
| 58 | Alec Bohm | 93 | 0.333 | 0.448 | 0.351 | 89.7 | 15.4 | 0.386 | 43.7% | 26.8% | 11.3% | 0.0% |
| 59 | Cedric Mullins | 87 | 0.299 | 0.455 | 0.339 | 87.6 | 6.4 | 0.339 | 43.5% | 24.2% | 8.1% | 0.0% |
| 60 | Gavin Lux | 82 | 0.310 | 0.479 | 0.373 | 88.7 | 3.7 | 0.356 | 43.3% | 21.7% | 3.3% | 0.0% |
| 61 | Dansby Swanson | 99 | 0.272 | 0.348 | 0.290 | 89.4 | 15.4 | 0.375 | 43.1% | 20.0% | 6.2% | 0.0% |
| 62 | Joey Votto | 93 | 0.192 | 0.397 | 0.319 | 89.6 | 9.3 | 0.204 | 43.1% | 29.4% | 11.8% | 0.0% |
| 63 | JJ Bleday | 85 | 0.213 | 0.387 | 0.303 | 88.2 | 19.2 | 0.280 | 42.3% | 21.2% | 3.8% | 0.0% |
| 64 | Vinnie Pasquantino | 87 | 0.308 | 0.526 | 0.375 | 89.5 | 12.5 | 0.308 | 42.0% | 23.2% | 8.7% | 1.4% |
| 65 | Javier Baez | 95 | 0.276 | 0.402 | 0.317 | 89.3 | 6 | 0.367 | 41.9% | 30.6% | 12.9% | 3.2% |
| 66 | Sean Murphy | 85 | 0.254 | 0.479 | 0.371 | 88.3 | 8.1 | 0.269 | 41.1% | 33.9% | 10.7% | 5.4% |
| 67 | Randy Arozarena | 83 | 0.280 | 0.467 | 0.352 | 89.9 | 7.1 | 0.340 | 41.1% | 35.7% | 21.4% | 1.8% |
| 68 | Rowdy Tellez | 76 | 0.281 | 0.609 | 0.402 | 89.9 | 18.7 | 0.279 | 40.8% | 30.6% | 18.4% | 6.1% |
| 69 | Christian Yelich | 96 | 0.253 | 0.354 | 0.324 | 90.7 | 0.1 | 0.370 | 40.7% | 35.2% | 18.5% | 5.6% |
| 70 | Gleyber Torres | 94 | 0.167 | 0.267 | 0.206 | 88.3 | 21.9 | 0.210 | 40.6% | 21.9% | 6.3% | 0.0% |
| 71 | Adley Rutschman | 93 | 0.300 | 0.457 | 0.406 | 88.2 | 10 | 0.357 | 40.4% | 28.1% | 12.3% | 1.8% |
| 72 | Daulton Varsho | 84 | 0.282 | 0.535 | 0.383 | 89 | 19.9 | 0.302 | 40.4% | 21.1% | 7.0% | 0.0% |
| 73 | Ramon Urias | 86 | 0.215 | 0.367 | 0.261 | 86 | 15 | 0.237 | 40.3% | 14.5% | 4.8% | 0.0% |
| 74 | Luis Rengifo | 99 | 0.295 | 0.474 | 0.340 | 88.2 | 9.4 | 0.325 | 40.2% | 18.3% | 2.4% | 0.0% |
| 75 | Willson Contreras | 80 | 0.250 | 0.515 | 0.376 | 85.1 | 10.2 | 0.260 | 40.0% | 32.0% | 14.0% | 2.0% |
| 76 | Patrick Wisdom | 79 | 0.235 | 0.471 | 0.341 | 87.5 | 22.6 | 0.279 | 40.0% | 28.9% | 20.0% | 2.2% |
| 77 | Seiya Suzuki | 88 | 0.171 | 0.317 | 0.230 | 87.5 | 10.2 | 0.186 | 40.0% | 20.0% | 1.7% | 0.0% |
| 78 | Andrew McCutchen | 87 | 0.257 | 0.446 | 0.347 | 90.9 | 14.3 | 0.279 | 39.7% | 30.2% | 7.9% | 1.6% |
| 79 | Alex Bregman | 96 | 0.333 | 0.595 | 0.421 | 88.3 | 18.5 | 0.324 | 39.5% | 22.4% | 5.3% | 0.0% |
| 80 | Harold Castro | 88 | 0.298 | 0.393 | 0.315 | 87.4 | 17.2 | 0.358 | 39.4% | 18.2% | 3.0% | 0.0% |
| 81 | Jorge Mateo | 76 | 0.333 | 0.611 | 0.411 | 87.9 | 15.2 | 0.385 | 39.3% | 26.8% | 14.3% | 0.0% |
| 82 | Rhys Hoskins | 93 | 0.272 | 0.494 | 0.370 | 88.5 | 18 | 0.315 | 39.0% | 28.8% | 8.5% | 0.0% |
| 83 | Josh Rojas | 85 | 0.303 | 0.421 | 0.338 | 89.8 | 9.1 | 0.323 | 38.8% | 17.9% | 3.0% | 0.0% |
| 84 | Trea Turner | 100 | 0.309 | 0.515 | 0.345 | 88.5 | 14.4 | 0.329 | 38.6% | 26.5% | 13.3% | 1.2% |
| 85 | Brandon Belt | 75 | 0.188 | 0.234 | 0.252 | 83.3 | 29.1 | 0.255 | 38.3% | 17.0% | 4.3% | 0.0% |
| 86 | Cody Bellinger | 80 | 0.203 | 0.514 | 0.306 | 89.6 | 20.9 | 0.182 | 38.3% | 18.3% | 1.7% | 0.0% |
| 87 | Jared Walsh | 89 | 0.173 | 0.284 | 0.228 | 87.8 | 8.4 | 0.241 | 38.2% | 20.0% | 7.3% | 0.0% |
| 88 | Carlos Santana | 76 | 0.123 | 0.308 | 0.234 | 87.9 | 23 | 0.096 | 38.2% | 21.8% | 1.8% | 0.0% |
| 89 | Taylor Ward | 98 | 0.207 | 0.356 | 0.283 | 88.1 | 17.7 | 0.219 | 38.2% | 17.6% | 1.5% | 0.0% |
| 90 | Corey Seager | 87 | 0.267 | 0.480 | 0.363 | 89.3 | 8.6 | 0.271 | 38.1% | 23.8% | 9.5% | 0.0% |
| 91 | Amed Rosario | 110 | 0.276 | 0.457 | 0.327 | 88.8 | 8.4 | 0.301 | 37.9% | 23.0% | 6.9% | 0.0% |
| 92 | Eugenio Suarez | 94 | 0.169 | 0.325 | 0.288 | 90 | 19.6 | 0.222 | 37.5% | 20.8% | 10.4% | 4.2% |
| 93 | Ha-Seong Kim | 79 | 0.276 | 0.421 | 0.311 | 88.2 | 15.9 | 0.345 | 37.3% | 23.7% | 1.7% | 0.0% |
| 94 | Luis Urias | 79 | 0.265 | 0.471 | 0.354 | 87.4 | 21 | 0.294 | 37.0% | 16.7% | 1.9% | 0.0% |
| 95 | Jeremy Pena | 96 | 0.217 | 0.337 | 0.247 | 85.6 | 2.7 | 0.261 | 36.6% | 21.1% | 5.6% | 0.0% |
| 96 | Brandon Drury | 92 | 0.220 | 0.463 | 0.321 | 87 | 17 | 0.232 | 36.1% | 19.7% | 9.8% | 0.0% |
| 97 | Yoan Moncada | 92 | 0.165 | 0.266 | 0.246 | 87.7 | 9.3 | 0.226 | 35.8% | 13.2% | 5.7% | 0.0% |
| 98 | Myles Straw | 83 | 0.185 | 0.247 | 0.182 | 87.5 | 7.8 | 0.214 | 35.2% | 4.2% | 0.0% | 0.0% |
| 99 | Leody Taveras | 88 | 0.244 | 0.305 | 0.259 | 86.7 | 9.4 | 0.345 | 35.1% | 22.8% | 7.0% | 0.0% |
| 100 | C.J. Cron | 98 | 0.187 | 0.330 | 0.241 | 88.7 | 14.4 | 0.234 | 34.8% | 21.2% | 12.1% | 4.5% |
| 101 | Jeimer Candelario | 84 | 0.228 | 0.430 | 0.301 | 88.3 | 10.2 | 0.259 | 34.5% | 17.2% | 5.2% | 0.0% |
| 102 | Nick Pratto | 80 | 0.182 | 0.364 | 0.291 | 85.1 | 21.5 | 0.256 | 34.1% | 26.8% | 4.9% | 0.0% |
| 103 | Jorge Polanco | 84 | 0.194 | 0.292 | 0.271 | 87.8 | 27.2 | 0.236 | 33.9% | 16.1% | 3.6% | 0.0% |
| 104 | Ketel Marte | 89 | 0.212 | 0.388 | 0.281 | 89.5 | 15.5 | 0.250 | 33.9% | 22.6% | 9.7% | 1.6% |
| 105 | Brandon Nimmo | 97 | 0.241 | 0.333 | 0.293 | 85.4 | 11.5 | 0.270 | 33.3% | 21.3% | 5.3% | 1.3% |
| 106 | Jonathan Schoop | 81 | 0.160 | 0.293 | 0.211 | 85.5 | 12.4 | 0.192 | 33.3% | 20.4% | 13.0% | 3.7% |
| 107 | Ramon Laureano | 90 | 0.190 | 0.345 | 0.257 | 86.3 | 21.5 | 0.255 | 33.3% | 27.8% | 13.0% | 0.0% |
| 108 | Ty France | 80 | 0.214 | 0.357 | 0.286 | 84.1 | 5.8 | 0.214 | 32.8% | 13.8% | 5.2% | 0.0% |
| 109 | Whit Merrifield | 76 | 0.247 | 0.356 | 0.274 | 84.5 | 11.6 | 0.298 | 32.8% | 8.6% | 0.0% | 0.0% |
| 110 | Nick Castellanos | 89 | 0.289 | 0.398 | 0.322 | 85.4 | 13.9 | 0.338 | 32.8% | 17.9% | 4.5% | 0.0% |
| 111 | Nico Hoerner | 83 | 0.284 | 0.432 | 0.347 | 86.6 | 12.3 | 0.306 | 32.8% | 16.4% | 3.3% | 0.0% |
| 112 | Hunter Dozier | 82 | 0.162 | 0.243 | 0.215 | 86.8 | 7.5 | 0.212 | 32.7% | 17.3% | 9.6% | 0.0% |
| 113 | Jake McCarthy | 78 | 0.286 | 0.343 | 0.315 | 86.1 | 4.3 | 0.339 | 32.2% | 15.3% | 1.7% | 0.0% |
| 114 | Willy Adames | 95 | 0.230 | 0.368 | 0.269 | 85.9 | 19.1 | 0.270 | 31.8% | 12.1% | 1.5% | 0.0% |
| 115 | Wilmer Flores | 87 | 0.276 | 0.461 | 0.360 | 87.1 | 21.3 | 0.300 | 31.7% | 15.9% | 3.2% | 0.0% |
| 116 | Joey Wendle | 92 | 0.244 | 0.300 | 0.245 | 87 | 2.4 | 0.289 | 31.6% | 17.1% | 2.6% | 0.0% |
| 117 | Starling Marte | 85 | 0.278 | 0.443 | 0.334 | 87.1 | 7 | 0.352 | 31.6% | 24.6% | 14.0% | 0.0% |
| 118 | Carlos Correa | 82 | 0.243 | 0.400 | 0.316 | 85.7 | 14.2 | 0.255 | 31.0% | 22.4% | 8.6% | 1.7% |
| 119 | Alex Verdugo | 89 | 0.329 | 0.488 | 0.375 | 89 | 12.7 | 0.388 | 30.9% | 11.8% | 7.4% | 0.0% |
| 120 | Luis Arraez | 76 | 0.315 | 0.425 | 0.332 | 89.5 | 14.9 | 0.328 | 30.9% | 4.4% | 0.0% | 0.0% |
| 121 | Nick Senzel | 76 | 0.203 | 0.275 | 0.244 | 84.5 | 9 | 0.259 | 30.8% | 19.2% | 1.9% | 0.0% |
| 122 | Kyle Farmer | 80 | 0.271 | 0.314 | 0.302 | 87.2 | 14 | 0.339 | 30.8% | 13.5% | 1.9% | 0.0% |
| 123 | Jose Ramirez | 101 | 0.261 | 0.424 | 0.301 | 85.9 | 18.2 | 0.256 | 30.6% | 18.8% | 8.2% | 0.0% |
| 124 | Dylan Carlson | 87 | 0.167 | 0.346 | 0.256 | 87 | 11.3 | 0.169 | 30.6% | 14.5% | 6.5% | 0.0% |
| 125 | Michael Taylor | 80 | 0.303 | 0.355 | 0.306 | 86 | 14.6 | 0.393 | 30.4% | 19.6% | 5.4% | 0.0% |
| 126 | Andrew Benintendi | 89 | 0.250 | 0.316 | 0.301 | 85.1 | 15.8 | 0.311 | 29.5% | 9.8% | 0.0% | 0.0% |
| 127 | Jonathan India | 78 | 0.271 | 0.471 | 0.353 | 87.2 | 18 | 0.333 | 29.4% | 13.7% | 0.0% | 0.0% |
| 128 | Andres Gimenez | 91 | 0.342 | 0.494 | 0.402 | 81.8 | 17.9 | 0.397 | 29.2% | 12.3% | 3.1% | 0.0% |
| 129 | Luis Gonzalez | 80 | 0.203 | 0.290 | 0.263 | 82.4 | 14.3 | 0.236 | 28.6% | 14.3% | 1.8% | 0.0% |
| 130 | Jarren Duran | 78 | 0.183 | 0.352 | 0.266 | 84.8 | 3.6 | 0.244 | 27.7% | 12.8% | 4.3% | 2.1% |
| 131 | Adam Frazier | 93 | 0.263 | 0.300 | 0.299 | 84.8 | 12.3 | 0.313 | 27.5% | 5.8% | 1.4% | 0.0% |
| 132 | Alek Thomas | 80 | 0.233 | 0.315 | 0.275 | 86.9 | 1.1 | 0.262 | 27.4% | 17.7% | 9.7% | 0.0% |
| 133 | J.P. Crawford | 91 | 0.235 | 0.272 | 0.259 | 83.7 | 5.7 | 0.247 | 27.3% | 14.3% | 5.2% | 0.0% |
| 134 | Aaron Hicks | 83 | 0.167 | 0.167 | 0.219 | 85.9 | 16.9 | 0.218 | 27.3% | 12.7% | 1.8% | 0.0% |
| 135 | Marcus Semien | 112 | 0.222 | 0.394 | 0.291 | 85.5 | 25.6 | 0.220 | 26.7% | 15.1% | 2.3% | 0.0% |
| 136 | Ryan Mountcastle | 88 | 0.169 | 0.247 | 0.226 | 87.8 | 17.1 | 0.203 | 26.7% | 15.0% | 11.7% | 0.0% |
| 137 | Ezequiel Duran | 84 | 0.256 | 0.359 | 0.294 | 82.7 | 17.8 | 0.339 | 26.3% | 19.3% | 1.8% | 0.0% |
| 138 | Jose Altuve | 105 | 0.298 | 0.457 | 0.357 | 83.2 | 14.7 | 0.317 | 26.2% | 15.5% | 4.8% | 0.0% |
| 139 | Charlie Blackmon | 92 | 0.190 | 0.274 | 0.230 | 85.6 | 7.1 | 0.209 | 26.1% | 17.4% | 1.4% | 0.0% |
| 140 | Yuli Gurriel | 86 | 0.259 | 0.346 | 0.277 | 87.9 | 10.5 | 0.284 | 26.0% | 16.4% | 2.7% | 0.0% |
| 141 | Marcell Ozuna | 78 | 0.184 | 0.329 | 0.219 | 87.4 | 20.7 | 0.224 | 25.0% | 23.1% | 15.4% | 3.8% |
| 142 | Jeff McNeil | 81 | 0.333 | 0.560 | 0.392 | 88.6 | 15.7 | 0.338 | 25.0% | 7.4% | 0.0% | 0.0% |
| 143 | Miguel Rojas | 84 | 0.216 | 0.257 | 0.250 | 83.7 | 16 | 0.246 | 24.2% | 9.1% | 3.0% | 0.0% |
| 144 | Isiah Kiner-Falefa | 79 | 0.260 | 0.315 | 0.274 | 85.8 | 5.7 | 0.295 | 24.2% | 4.8% | 0.0% | 0.0% |
| 145 | Jake Cronenworth | 93 | 0.216 | 0.324 | 0.310 | 84.8 | 20.4 | 0.237 | 23.3% | 6.7% | 3.3% | 0.0% |
| 146 | Kevin Newman | 87 | 0.256 | 0.354 | 0.285 | 82.5 | 8.6 | 0.328 | 22.2% | 12.7% | 1.6% | 0.0% |
| 147 | Jose Iglesias | 89 | 0.358 | 0.444 | 0.362 | 81.6 | 3.5 | 0.414 | 21.4% | 5.7% | 1.4% | 0.0% |
| 148 | Cesar Hernandez | 89 | 0.253 | 0.329 | 0.291 | 79.7 | 12 | 0.313 | 19.7% | 4.5% | 1.5% | 0.0% |
| 149 | Steven Kwan | 107 | 0.340 | 0.474 | 0.380 | 82.8 | 10 | 0.369 | 15.1% | 2.3% | 0.0% | 0.0% |
Chapman has been crushing the ball a lot longer than since the break, but through Sunday, his slash line was still just .239/.319/.473, which speaks to how unlucky he was to begin the season. He's sporting the seventh-highest launch angle over this span, so he's not just hitting the ball hard he's elevating it, boosting his power. Chapman's flyball average exit velocity since the break is 97.3 mph, the 12th highest. There are some intriguing names ahead of him:
| Player | ExitVel |
|---|---|
| J.T. Realmuto | 100.8 |
| Oneil Cruz | 100.5 |
| Paul Goldschmidt | 100.3 |
| Trent Grisham | 99.6 |
| Salvador Perez | 99.2 |
| Aaron Judge | 99 |
| Willson Contreras | 98.4 |
| Byron Buxton | 98.4 |
| Chas McCormick | 98.2 |
| Yordan Alvarez | 98.1 |
| Hunter Renfroe | 97.4 |
| Matt Chapman | 97.3 |
A few of them will be discussed momentarily. Suffice it to say Chapman has exhibited the ability to sustain a high level longer than most of the names, which bodes well for the rest of the season.
However, it should be noted Chapman's strikeout rate has picked up over the second half, spiking to 36.3 percent for the last few weeks after he posted a palatable 25.6 percent clip over the first half.
Even so, not only is Chapman someone to consider for the stretch run, he's a prime target in keeper leagues, even if you need to wait until the offseason to make your pitch. His final numbers will still fall short of his skill level.
Regular readers know I'm a component BABIP wonk. Pham is a great example. Look at his launch angle. He's hitting the ball exceptionally hard, but he's not elevating it as much over the second half. To wit, Pham's average launch angle was 9.0 degrees through the break, but only 5.4 degrees since. Perhaps the inviting Green Monster will give Pham the impetus to put a few more batted balls in the air. Hitting leadoff in a potentially potent lineup doesn't hurt either. Pham hasn't pilfered a base since July 3 (he's been caught twice in that span), but it wouldn't be surprising if he snagged a handful, especially if he's successful on his first try as Boston runs when the percentages are in their favor.
Muncy is a lot like Chapman, but on a smaller scale. He's elevating the ball with authority, but his strikeout rate has also increased as he's posted a 29 percent mark since the break compared to 24.2 percent over the first half. The primary difference is while Chapman was hitting the ball hard for much of the season without commensurate results, Muncy's prebreak average exit velocity was just 88 mph, leading to a low .188 BABIP (which was also unlucky).
The takeaway is Muncy has found his stroke since the break, and even if he falls back some, his current level is more akin to his track record than how he opened the campaign. Muncy's average should remain a drain, but he should be good for some pop as he's already clubbed five long balls in August.
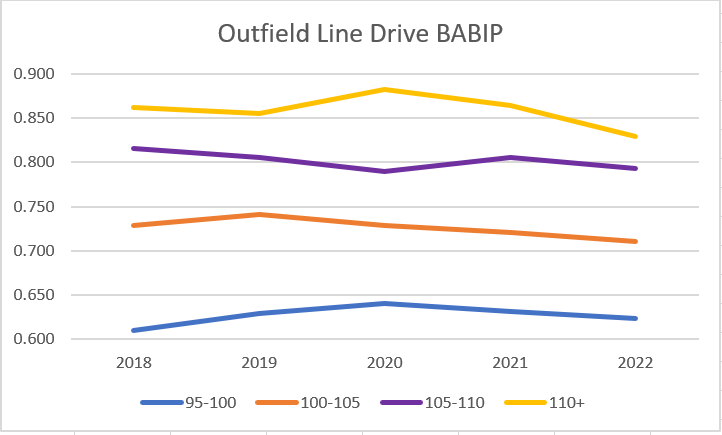
Grisham is among the league leaders in hard-hit rate, but his .244 BABIP is just 116th highest among those qualifying for the study. He's hit nine grounders over 95 mph, four of which eclipsed the century mark with one topping 105 mph. However, he's 0-for-9 on his hard-hit groundballs becoming hits since the break. Using the BABIPs shown on the above Groundball chart, Grisham should have garnered four hits on these nine grounders. On the other hand, he's tattooed five hard hit outfield line drives, two over 100 mph with two more surpassing 105 mph, and all have landed safely. That said, based on outfield line drive BABIP, at least three, likely four should have been hits so overall he's still been unlucky on hard-hit balls.
Grisham has fanned at a 22.8 percent clip since the break, a couple of ticks below his usual mark. His playing time might have been in jeopardy once Fernando Tatis returned, but that's no longer a concern. Grisham isn't going to win a league, but he's a sneaky "throw-in" to a larger deal with some plausible upside if he achieves results commensurate with how well he is hitting the ball.
Miranda is a nice example of a player both lucky and good. His .407 BABIP since the break is driven by hitting the ball with authority and receiving the requisite results, along with good fortune on batted balls hit with lower exit velocities. On paper, his hit rate should regress (and it likely will), but the landing point could still be high if Miranda continues anything close to his current hard-hit rate.
A couple weeks ago, when reviewing first-half earners, it was pointed out if Harris' numbers were prorated, he'd be a top-20 overall player, let alone outfielder. The caveat was he likely wouldn't have maintained such a high level of play if he broke camp with the club. As it turns out, he indeed has not sustained that level… HE'S PERFORMED EVEN BETTER!
Harris is tied for 10th in percentage of balls hit over 110 mph.
1 | Aaron Judge | 20.80% |
2 | Vladimir Guerrero | 12.90% |
3 | Kyle Schwarber | 12.50% |
4 | Austin Riley | 11.90% |
5 | Oneil Cruz | 9.30% |
6 | Yordan Alvarez | 9.10% |
7 | Pete Alonso | 6.10% |
8 | Rowdy Tellez | 6.10% |
9 | Eloy Jimenez | 6.00% |
10t | Jose Abreu | 5.90% |
10t | Michael Harris | 5.90% |
Wow, that's an impressive neighborhood. Cruz also deserves a special nod. Acquiring Harris via trade this season is likely impossible from a practical sense. As reticent as I am about trusting young players, I'm likely going to be in on Harris next year. You don't hit the ball this hard by accident and he is in select company, even if he falls off down the stretch.
I was planning on discussing Steven Kwan, Jose Iglesias and Andres Gimenez, but they're all more about a high level of play without stellar exit velocity. Let's keep this discussion to those crushing the ball since the break, and I'll find a way to weave that trio into an upcoming Todd's Takes. Deal?


